1
How did the deportations of 1892–1921 impact immigrant communities in the United States?
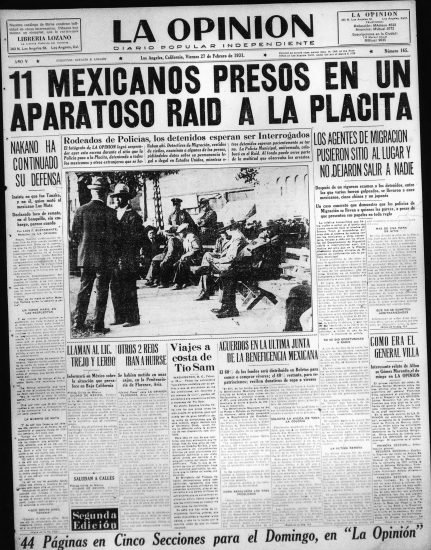
Historic La Opinión front page covering mass deportation arrests.
Immigration and deportation policy has become a topic of fierce contention within the past few years in the United States. Under the current federal administration, the United States has seen a sharp increase in deportations, with some considering them favorable and others harshly criticizing these policies. However, these policies are not new to the United States; changing deportation policies dates back centuries. Our study looks at the history of these deportations, specifically within the years 1900 to 1921, highlighting the impact they had on different communities in the U.S. The national and racial categories with the highest raw amounts of deportations were the English and Mexican, with English communities mainly residing in the Northeast and Mexican communities residing in the Southwest.
Our study draws upon numerical data regarding the number of deportations and their reasons, peer-reviewed studies of their impact, congressional hearings regarding legislation, and different policies that impacted both immigration and deportations. These sources provide important context for the social and political climate of the early 20th century to better understand why these deportations occurred, and more importantly, how both the English and Mexican communities within the U.S. were affected.
Overview
How did the deportations of 1892–1921 impact immigrant communities in the United States?
How do the laws and regulations of 1892–1921 affect the deportation of immigrants of unique backgrounds?
How do the deportation rates between 1892–1921 reflect the U.S. political beliefs during that time?
Timeline
Interactive timeline of key immigration and deportation events from 1900–1921.
Navigation
View the Tableau map of English and Mexican communities, other graphs, and our key takeaways.
Read more »Open the original and cleaned datasets and review our data overview and critique.
Read more »Browse the annotated bibliography that shaped our narrative and graphical work.
Read more »Meet the team behind the project and the roles we played in researching and creating this project.
Read more »Team

Project Manager
Hi, I’m Dylan, a third year Pre-Business Economics major looking into minoring in accounting as well. I took on the role of Project Manager and ensured that all project guidelines were met and done efficiently and on time. I led communications and helped delegate tasks throughout the project’s lifecycle.
Data Specialist
Hello! I’m Kenny, a third year Communications major and Entrepreneurship minor from San Diego. I managed the cleaning, standardization, and refining of our data set to ensure smooth and accurate analysis for our final project.
Editor
Hi, my name is Yuexi Liao. I am a third year Pre-Math and Economics major. As an editor, I was in charge of editing all content on the website to ensure the narratives were cohesive and conveyed the correct information.
Data
Hi! I’m Yitian, a third-year Economics major with a strong interest in data analysis and visualization。
Content Developer
Hey! I’m Yahir, a third year Sociology major looking to go into marketing. As content developer I ensure that our group’s main argument, maps, and data visualizations integrate nicely into our website.
Web Developer
Hi, my name is Rohan Akurathi, I am a fourth year Statistics and Data Science student at UCLA. As a web developer I create the website stylistically and fundamentally putting together all our thoughts and ideas.
Selecting Our Sources: For our project, we selected a dataset from Harvard University’s Dataverse, which contains deportation records from 1893 to 1921. This dataset was especially appropriate for our research because it provides a long historical timeline and includes detailed information about each deportation case, such as the individual's nationality, the year of deportation, the deportation location, and even geographic coordinates. These variables allowed us to focus our analysis on comparing English and Mexican immigrants, which became the central research question of our project.
As our class readings explain, digital humanities projects often rely on large public datasets that carry both significant value and significant limitations. The Dataverse dataset is comprehensive, but it also reflects the inconsistencies of historical record-keeping. Many entries contained missing or ambiguous information—for example, nationality listed as “Unknown,” incomplete deportation locations, or inconsistent formatting across categories. Rather than being a flaw, these irregularities highlight the challenges of working with historical data and show how DH researchers must interpret archives that were not originally created for modern analysis.
We chose this dataset because it allowed us to explore how deportation practices changed over time and how different national groups were treated under U.S. immigration policies. Its richness made it useful for visualization, while its imperfections required thoughtful data cleaning. This combination aligns with the goals of digital humanities: using digital tools to analyze historical evidence while remaining aware of how the structure of the data shapes the stories we can tell.
Processing Our Data: The data set we used was from Harvard University’s Dataverse website (dataverse.harvard.edu). The data had lots of information regarding United States deportation data from the years 1893 - 1921, including where their country of origin was, the year they were deported, and even the coordinates that they were deported from. However, much of the data had to be cleaned because of the comprehensive list of deportations from this time, each entry had inconsistent information. For example, some did not include the deportation locations, others were lacking the ethnic origin of the people. Due to these inconsistencies, our team had to clean the dataset by choosing which factors to focus on as well as narrowing down the scope of the project to analyze the information that was most consistent. We decided on specifically English and Mexican deportations from the years 1900 - 1921 and focused on the year of deportation, reason for deportation, and the number of people deported.
After downloading all of our data from Harvard’s Dataverse into an excel spreadsheet, we selected the data we wanted to focus on and then uploaded it to Tableau. We used Tableau for our data visualizations and implemented embedded code on the website to make our visualizations more interactive. We also added alt text for accessibility. While we used many different visualization types, we created each one while factoring in the best way to represent every type of data to tell the most coherent narrative.
Presenting Our Narrative: In terms of technical implementation, our team utilized the website-building features provided by GitHub Pages to quickly establish the overall framework of the project website, leveraging its built-in Jekyll theme. Although we learned to create a website using WordPress, our group chose to use GitHub because it allows all group members to access and edit the website. On the website, we chose a black theme, white fonts, and some red and gold titles to increase the text’s contrast and fix our topic about deportation. In terms of styling, we reused the theme’s built-in CSS, making minor modifications to unify the overall layout, fonts, and color scheme. For data visualization, we embedded external tools (such as interactive charts generated by Tableau) to display maps and charts. We also provide alt text for our visualizations and hyperlinks to make our website reader-friendly. The HTML headers in the upper right corner help the reader navigate our sections on different independent pages. Lastly, we utilize the cursor AI to make the website.
We, the Deportation Data Analysis Group, would like to express gratitude for the support we received through the process of creating this project!
To Dr. Wendy Kurtz: Thank you for sharing your knowledge of the Digital Humanities field and guiding us throughout the course. We appreciate the tools and instructions you provided to us as we created our research project. Lastly, we would like to express our gratitude for the opportunity to develop our skills through an impactful project. Thank you!
To Kai Nham: Thank you for your guidance and support you provided throughout the quarter! The feedback you provided us was invaluable, and we appreciate the time and effort it took to review our project. Thank you!
To ChatGPT: We would like to thank ChatGPT for being a tool that helped us through the creation of this project. The brainstorming, proofreading, and basic research helped guide us through the early stages of the project. Thank you.
Our Findings
This map was created using Tableau. It displays significant English and Mexican communities within the United States, along with their populations. This data was found separately from our main data source, and the numbers came from the United States Census of 1920, meaning it uses population numbers from this year. This map was chosen because it is simplistic in nature yet clearly displays what needs to be shown. The size of each circle represents the size of the population within the cities, and the color represents the community within. One thing that should be noted, however, is that there is also a Mexican community in Chicago, with a population of 20,000, but it is covered by the dot representing the English community. We mustn't just look at the numbers representing these communities, but also where they were located, because of the context it provides.
One specific point about the geographical data in this map is the specific locations of these communities. There are a large number of English communities in the Northeast because a majority of English immigrants came through Ellis Island, which is in New York City. In addition, there were many industrial centers in this area, which many English communities were connected to. In the Southwest, there are a large number of Mexican communities because they immigrated through the Southern border. There were large agricultural centers in the Southwest as well, which is where a majority of Mexicans worked. A majority of these communities were in these locations due to labor-related reasons. Overall, knowing the location of these communities is important to our project because we can see how these agricultural and industrial communities see how they were impacted by deportations. It helps put it into perspective as well, as we can see that the impact of them was felt widely and not in one single area.
From the line graph, we can see that both the deportations of English and Mexicans started relatively slowly, and had a small peak in the year 1910 for both nationalities. Afterward, there was a decline in deportations, and they slowly rose until around 1915, when we began to see a large difference in the trends. For those of an English background, the rate/level of deportations stayed relatively the same, yet deportations of Mexicans had a sharp increase, peaking in 1919, before sharply decreasing and increasing yet again. This opens us up to new questions, such as, “What caused this sharp increase in deportations of Mexicans in 1919?” and “Why were the English deported less at this point compared to Mexicans?”
From the chart, we can see that the largest value for the reason for deportation for those identifying as English and Mexican was “Likely to become a public charge.” This means that they were unable to support themselves financially and were more likely to rely on government services. From our research, we’ve seen that a significant reason why people were deported was due to economic and labor-related reasons. This being such a large reason for deportation raises more questions, such as what constitutes being labeled “public charge” or if the title was applied lightly.
Looking at the graph itself we can see the difference in the two groups. The top four reasons for UK immigrants to be deported were due to “entered without inspection”, “contract laborers", “convicts/criminals” and “likely to become a public charge”. Compared to Mexican immigrants top four reasons were “contract laborers”, "likely to become a public charge”, “prostitutes”, and "aliens who procure or attempt to bring prostitutes or females”. This is very telling of the attitude towards the different groups. This relates to our project as we want to compare the two groups and the reasoning behind their deportation. We then want to see how this affected their communities and the social impact these deportations had on surrounding communities as well.
The most common reason of the Pareto graph was, “Likely to become a public charge” at roughly 40%. This shows how deportation functioned as an economic gatekeeping mechanism. Officials were seeing migrants through the lens of a financial burden to the country, and saw them as an economic net negative rather than a positive. The second highest category was “entered without inspection” at around 30%, which reflects the increasing regulation of border control in the early 1900s. These two categories alone account for the overwhelming majority of deportations, reflecting how the United States was becoming more strict on their borders and how the new immigrants would need to have a high perceived value before residing in the country. In contrast, some of the smallest categories included “Epileptics,” “Paupers,” and “Feebleminded,” which are historically important because they reflect eugenic and moral classifications common at the time, yet their low percentages demonstrate that these stigmatizing labels were less central in actual deportation outcomes.
While similar to a bar chart, the Pareto chart is beneficial because we can see the percentage contribution to the total reasoning deportations. The orange bars represent the individual value of each reason, and the blue line represents the percent total each bar contributes. If we want to view a specific percentage of deportations occurring, we can adjust the parameters with the slider to view which categories contributed to this value. For example, if we want to look at the reasons for deportation were between 38.9% and 66%, the chart will show that these categories are “Likely to become a public charge,” “entered without inspection,” and “prostitution.” We cannot adjust the parameters to 0% however, because this would mean that no deportations occurred, which is untrue.
This chart depicts an area graph comparing the cumulative number of deportations between English and Mexican individuals. While it’s similar to a line graph, the area graph is also beneficial to include because it helps us see the contribution to total deportations per year. The area shaded underneath each point is representative of the contribution to this total. Initially, this graph may be confusing because it may seem as though more English were deported; however, the area underneath the line is smaller, showing that they contributed to a smaller amount compared to Mexicans. By hovering over each data point, we can see the number of deportations for each group. Consistently, we can see that the number of Mexicans deported between 1900-1921 was much higher than the number of English individuals deported.
“You can't undo a deportation.” - Author Attorney Jonathan Shapiro. Between 1900 and 1921, the United States deported thousands of Mexicans and English from their communities. These actions by federal agencies showed a growing sentiment and national effort to control immigration. The government often justifies these actions by citing public concern about economic, social, and welfare issues. These actions were often driven by perceived threats rather than by substantive factual evidence. Deportation policies became incredibly targeted and systematic, going after specific groups such as Mexicans and the English. Within these communities, specifically these deportations created long-lasting effects in millions of people's daily lives; disrupting families, creating feelings of instability, reshaping the workforce, and creating a sense of vulnerability. People lived with the knowledge that any interaction with officials could result in separation from their homes and loved ones. Going beyond the pure numbers and looking at the historical context of this time period through various forms of media allows us to understand how immigration policy uproots and shapes entire communities. The gap between policy intentions and human consequences reveals a crucial hole in how we understand this period of American history.
The period of deportations between 1900 and 1921 saw a more modernization of immigration enforcement within the United States. These deportations were characterized by the establishment of “deportation arrests” (Nash), allowing enforcing agencies to target non-citizens based on their status. This was different than before, as most were deported for criminal activity. Immigrants were less protected legally against mass removal compared to criminal charges (Gulasekaram). Much of this policy change was due to fears in the American public, many of which surrounded politics and economic conditions (Seller). The fears surrounding economic conditions were devised from concerns that immigration had led to slowed wages of U.S.-born citizens and older immigrant workers (Lauck), leading Congress to enact “restrictive and selective” measures aimed at controlling the “quality” of immigrants that entered the U.S. (Peirce). As time passed, from 1908 onward, there was a shift in deportation reasoning to paperwork violations instead of criminal issues (King); however, wartime anxieties also led to new proposals such as the 1919 Bill (H.R. 13965) that aimed to deport “undesired aliens” for “any offense” (Deportation of Interned Aliens). This system was criticized for breaking apart families (Kellor), which is a large factor that harmed many communities like the English and Mexicans within the U.S. Much of these deportations were due to racial discrimination and happened in communities along the southwestern border, leading to a “historical memory” of vulnerability and a distrust of authorities (Hernandez). Despite all of this, there are some contradictions that exist between the reasoning for deportations. In this period, policy was aimed at reducing economic stress on U.S.-born citizens through slowed immigration and increased deportations; however, many scholars disagree and argue that this change was due to racial discrimination that was heavily prevalent in this period. Although scholars may disagree on the reasoning for the deportations, what can be agreed upon is that they had a significant impact on communities, such as Mexican and English, for better or for worse. Much of what has not been researched surrounding this topic is the impact it has had on the mental health of people within these communities. There are plenty of economic and population data, yet the impact it had on development and its connection to humanistic data may remain unknown.
The significance of our project lies in its ability to connect historical deportation patterns to broader questions about how immigration policy shapes the lived experiences of communities. While scholars have written extensively about the political and economic motivations behind deportations, far less attention has been given to how these policies affected people on a human level—particularly their mental health, family stability, and long-term sense of security. I am working on this topic because I want to find out how the rise of deportation enforcement between 1900 and 1921 changed the daily lives of immigrant communities so that I can help others understand the deeper social and emotional impact behind these historical events. Our data visualizations reveal measurable patterns—such as increases in arrest rates and policy shifts toward “quality control”—that can be linked with meaningful human consequences. By examining deportation through both statistical trends and humanistic perspectives, this project encourages readers to think beyond policy numbers and recognize the lasting psychological and social effects these actions left on Mexican, English, and other immigrant groups. Ultimately, the significance of our work is its effort to bridge quantitative historical data with the lived experiences that are often missing from traditional immigration research.
Synthesis
Deportations between 1900 and 1921 altered immigrant communities by establishing an environment of uncertainty, social pressure, and institutional scrutiny that reached well beyond the persons actually taken. Deportation enforcement tended to concentrate on administrative infractions or changes in federal policy for groups like English immigrants, so communities saw the system as a bureaucratic annoyance rather than an existential danger to their presence in the nation. In contrast, Mexican communities endured a deeper and more constant sense of vulnerability. Rising removals during the Mexican Revolution, coupled with increased federal authority through legislation like the Immigration Act of 1907 and later wartime measures, meant Mexican migrants increasingly lived with the potential of unexpected expulsion. In order to evade authorities' attention, some migrants were encouraged to migrate seasonally or congregate in supportive enclaves as a result of these policies. Across both groups, deportation policies suggested that membership in the United States was dependent on political moods, economic situations, and altering concepts of national identity, emphasizing that immigrant life in this period was molded as much by changeable enforcement as by opportunity.
Laws and restrictions enacted between 1892 and 1921 profoundly transformed how the United States targeted and expelled immigrants from different backgrounds, causing disparate results across nations. The federal government's power to exclude and deport people for economic, moral, and medical reasons was established by early laws such the Immigration Act of 1907 and the Expatriation Act, but these criteria were used inconsistently based on racial presumptions and public opinion. Due to administrative or technical problems, such as becoming a public charge within a year of arrival, English immigrants—who were often thought to be culturally compatible—were more likely to be deported. By contrast, immigrants from Mexico and other non-European regions faced greater scrutiny as new legislation broadened the definition of deportable acts. The Anarchist Exclusion Act added categories such as anarchists and those with certain disabilities, and the Immigration Act of 1907 broadened the federal government’s ability to deport individuals for moral and medical reasons while increasing funding for enforcement. Mexican migrants, already moving north in response to political instability and economic pressures, encountered a system that now had both the legal tools and the institutional capacity to target them more aggressively. Together, these regulations created a deportation regime that was formally national in scope but substantively shaped by racial hierarchies and evolving ideas about who belonged in the United States.
Deportation rates from 1892 to 1921 reflect the political beliefs that defined the United States during this period. It was able to reveal how immigration enforcement served as both a policy tool and a reflection of national identity debates. The rise in deportations in this period aligns with the expanding federal bureaucracy that viewed immigration as more and more of an issue that required centralized control, particularly as new laws broadened the categories of who could be removed. Periods of increasing removals often correlated with increased surges in nativist sentiment, economic downturns, and fears about social disorder. By the late 1910s and early 1920s, wartime nationalism and a rising commitment to “Americanization” produced stricter standards in who the government let into the country. These patterns show that deportation practices were not neutral administrative actions but were shaped by shifting public attitudes toward race and the meaning of American identity.
Method & Ethics
| Nameoftable | Year | categoryofpeople | nationalandracialcategories | NatandracName | Natandraciso_alpha | DeportedFrom | DeportedFromLat | DeportedFromLong | DeportedTo | DeportedToName | DeportedToiso_alpha | numberofpeople | Unnamed: 13 |
|---|---|---|---|---|---|---|---|---|---|---|---|---|---|
| 1892 | 1892 | (1yr.) Returned within of landing | Unknown | Bermuda (UK) | BMU | Baltimore, Md | 39.2848882 | -76.7605804 | Unknown: Port of entry | — | — | 5 | — |
| 1892 | 1892 | (1yr.) Returned within of landing | Unknown | Bermuda (UK) | BMU | Boston, Mass | 42.3145167 | -71.2504659 | Unknown: Port of entry | — | — | 89 | 49729 |
| Year | Reason for Deportation | National/Racial Categories | National and Racial Name | Deported From | Number of People |
|---|---|---|---|---|---|
| 1900 | (1yr.) Returned within of landing | Mexican | MEXICO | Unknown: Port of entry | 10 |
| 1900 | (1yr.) Returned within of landing | English | UNITED KINGDOM | Unknown: Port of entry | 38 |
The information that is included is mainly the number of deportations from the United States in the period from 1892 to 1921. Additionally, the dataset provides more information, such as the ethnicities and nationalities of the people who were deported. The locational data includes what state and city each person was deported from, and what country they were deported to. The reasoning for why each person was deported is also included, which ranges from disease to some people committing crimes. One piece of information that might be interesting to look into is people being deported for being considered an “idiot/imbecile.” We are unsure as to what this constitutes, as it seems like a very subjective reason to deport someone. Another thing that this data reveals is that a large number of Germans and Italians were deported, despite the Chinese Exclusion Act being in place. It appears as though these populations were heavily targeted. Overall, this data provides a lot of background information that will help guide us as we conduct our research and helps reveal what communities may have been targeted.
Although this data reveals much valuable information regarding all forty thousand plus deportations in America from 1893–1921, it does not reveal the personal stories of the people listed, as well as the contexts that they were deported under. Political pressure, racial problems, or economic hardship could all be reasons why these decisions were made. It also lacks contextual information regarding what the United States' deportation policy was like at the time, as well as what leaders were in power that may have influenced an influx of deportations. It also does not represent the human aspect at all, and what effect these displacements have had on the families and their lives. This is the main problem with quantitative data, as it lacks context that explains the deeper political, social, and racial implications of what affected these numbers.
The data is generated onto a sheet. Most of the data centers on the port of deportation, the grounds for deportation, and the destination of deportation. Some columns will also depict exact longitude and latitudes for where the deportation took place. The source itself was found through the Harvard Dataverse Website. However, the author of the dataset is Torrie Hester, a history professor at Saint Louis University. She seems to be very involved with educating about deportation, and this dataset was made for “Deportations from the United States: A Visual History” (DVH) (2020-11-10). This data was published on November 23rd, 2021; however, it was added to the repository on November 10th, 2020. There is no public confirmation on who funded this data.
A lot of information is left out about this dataset. This dataset is sourced from the Harvard Dataverse website, which is accessible on Canvas; although the website has the metadata section, this only describes the general contexts of the dataset and does not explain the meaning of the categories and values of the dataset. Additionally, this dataset contains numerous blank spaces, mostly in the DeportedFromLat, DeportedFromLong, DeportedTo, DeportedToName, and DeportedToiso_alpha categories, which provide information on the port of deportation and the destination of deportation—data important for understanding deportation routes and patterns; some data in NatandracName and Natandraciso_alpha are also missing, but compared to the amount of missing data in the previously mentioned categories, it's just a small amount.
The dataset also does not provide any personal information about the deported people, such as their family backgrounds, education levels, or economic status, which are essential clues for understanding the reasons for deportation and the deportation patterns. Moreover, the reason for this missing data is not explicit. This also ties into what the dataset cannot reveal: without contextual, personal, and legal details, we cannot see individual experiences, the agencies driving enforcement, or the full legal landscape behind each removal.
The dataset shows certain ideological effects in how deportation data was recorded and presented. It treats people mainly as numbers and cases instead of individuals with personal stories. This reflects how the U.S. government at that time viewed deportation—as an administrative or legal issue rather than a human one. The way the data is organized also suggests a belief that the process was neutral and objective, but in reality, it was influenced by politics, racism, and economic interests.
Another ideological effect comes from who created the data. Since it was collected by government officials, it only shows one side—the state’s perspective—and not the voices of the people who were deported. This imbalance shows how data can reflect the power structure of its time. In short, the dataset not only documents deportations but also carries the ideas and values of authority and control that shaped U.S. immigration policy back then.
Citations
Talks about three main ways in which immigration and crime rates are related and goes into detail on policies that can hurt or defend immigrants. The first of these ways is that the crime rate significantly increases when immigration rates also increase. In order to solve this, one must either limit immigration or start deportations. The second way is that sometimes those foreigners have different cultures and understandings, which could mean that their temptations are different. Therefore, there must be crime prevention programs to remedy this. And the last one is that it is necessary to have a program in place to ensure foreign-born people have the same access as domestic-born people in terms of getting justice.
The authors question the claim that anti-immigration policies can protect public health. They believe these policies will force people to hide underground, which will harm public health. Moreover, Western policymakers will blame all the medical pressure on immigration, so the government will deliberately abandon those undocumented populations. Then, the authors use research on public health and immigration mental health to prove that “the U.S. public health system’s failure to protect immigrants is a failure of its own mission.”
This congressional hearing in 1919 covers H.R. 13965, a bill proposed by the Department of Justice to deport “undesired aliens,” targeting those interned during World War I and those convicted of crimes against U.S. law during the war. The House committee raised concerns over broad language that allowed deportation for “any offense.” This report helps connect policies of 1919 to the dataset’s odd reasons for deportation, highlighting parallels between policy and recorded cases.
Links mass deportation to global capitalism and labor control, showing how enforcement targets racialized workers to maintain economic inequality. Adds an economic and sociological view on deportation systems, aligning with the project’s focus on social impacts.
Examines the historical and legal status of non-citizens and their constitutional rights, arguing courts and Congress created a distinction between citizen rights and non-citizen privileges, leaving non-citizens vulnerable to mass deportation. Useful for explaining why deportations were disruptive and how limited protections affected communities.
Traces the U.S. Border Patrol’s origins and shows how race and politics influenced enforcement, arguing deportation practices were rooted in racial discrimination. Provides historical context on deportation policy and enforcement culture, especially along the U.S.–Mexico border.
Hernandez looks at the history of anti-Mexican sentiment and organized expulsions, mostly in the 19th century, and connects them to later 20th and 21st century deportation practices. This article argues that these repeated expulsions created a “historical memory” of vulnerability for Mexican American communities. By focusing on regional expulsions that happened before federal deportations were fully enforced in 1892-1921, Hernandez shows how these communities were already traumatized and wary of authorities. This history shaped collective identity and fostered deep distrust of the government. The article is helpful in understanding the impact on Mexican immigrant communities around the period of our research question. It shows how people were displaced and how communities organized under policies of the federal government.
Argues for reforming U.S. immigration policy to mitigate harms of existing legislation. Proposes distribution, protection, and education to help immigrants assimilate and critiques allowing immigrants in only to later deport them. Useful for examining how lack of resources and deportations disrupted families and communities.
Analyzes deportations 1908–1986 using immigration yearbooks, showing shifts from criminal grounds to paperwork issues and linking spikes in violent crime rates to increases in deportations. Helps contextualize numerical data with enforcement drivers, though light on media and political framing.
Discusses impacts of recent immigration on U.S.-born citizens and earlier immigrants, arguing many arrivals were driven by transportation companies for short-term labor, depressing wages and working conditions. Advocates literacy tests and head taxes to curb unskilled labor. Provides background on economic arguments driving restrictive policies and deportations.
Explains how post-1965 restrictive policies unintentionally increased long-term Latin American migration, as enforcement discouraged return trips. Supports analysis of how policy shapes migration trends; data is credible but less current for recent effects.
Tracks how deportation arrests emerged as a distinct legal tool targeting non-citizens based on status, giving immigration agents broad powers. Shows the parallel enforcement system that left immigrants vulnerable between 1892 and 1921, clarifying legal risks to communities.
Links anti-immigrant policies to mental health harms and identity stress in immigrant families, arguing these are public health issues. Recommends measuring policy impacts on health, investing in care in anti-immigrant regions, and supporting services for undocumented populations.
Reviews immigration policy changes since 1882, grouping them as restrictive, protective, distributive, and administrative (effectively restrictive and selective). Highlights focus on controlling the quality of immigrants rather than quantity.
Synthesizes immigration policy debates from the 18th to early 20th centuries, arguing recurring concerns about jobs, culture, and loyalty reflect national fears more than immigrant actions. Offers historical framing for enforcement trends like those in the DHS data; limited on post-1965 analysis.
Explores how immigration and immigrants shaped performance, minority representation, and social change on stage during the Progressive Era. Useful for understanding cultural conflicts and responses that underpinned deportation policies.
Provides counts of removals and returns from 1892–2017, showing shifts from voluntary returns to formal removals and evolving enforcement severity. Reliable long-term data but lacks demographic details and year-to-year explanations.
Breaks down the 1907 Immigration Act, including increased head taxes, equal treatment for those deemed “imbecile,” and added physical tests for “aliens.” Outlines the act’s sections, illustrating how statutory changes shaped who could stay or be deported.
Population figures for English and Mexican communities (1920 census) used in the interactive map of community locations.